Earned Media Measurement: The Executive Playbook for PR ROI in 2026 [Examples + Tips]
Whether you’re a skeptical executive, a meticulous marketing head, or a fickle founder, few questions weigh on your mind — or carry more budget implications — than “Is PR actually working?” The challenge is rarely a lack of activity. Mo...
- Home
- Intelligent Insights Blog
- Earned Media Measurement: The Executive Playbook for PR ROI in 2026 [Examples + Tips]

Whether you’re a skeptical executive, a meticulous marketing head, or a fickle founder, few questions weigh on your mind — or carry more budget implications — than “Is PR actually working?”
The challenge is rarely a lack of activity. More often than not, it’s a simple failure to accurately and effectively execute business-aligned measurement.
A lot of earned media reporting continues to crutch on vanity metrics — impressions, reach, SOV, and coverage volume. While these are still useful to track as directional indicators, they rarely reveal the larger picture of what earned media is actually contributing to business growth.
Outdated framing makes earned media harder to defend, scale, and optimize. The trick is to stop treating it like a brand function when it’s actually a performance and growth lever.
In 2026, flawed proxies like AVE no longer cut it. Category leaders must evaluate earned media based on:
- Pipeline Impact
- Revenue
- Sales Velocity
- Hiring Outcomes
- Brand Authority
This shift isn’t just about better PR reporting — it’s about connecting coverage with business performance through clear calculation models and structured measurement systems.
In this guide, we’ll break down everything from the core principles of EMV and why traditional PR metrics fall short to four practical ROI models and how to build boardroom-ready reporting frameworks.
Ready to equip yourself with a repeatable approach to earned media measurement that reveals real growth impact? Let’s dive in.
- What Is Earned Media Measurement?
- Why Most Companies Measure PR Wrong
- The 4 Core Earned Media ROI Models
- Earned Media Value vs Business Impact
- How to Build an Earned Media Reporting Dashboard
- Board-Level Reporting Framework
- Common ROI Measurement Mistakes
- How to Align Earned Media Metrics With Business Objectives
What Is Earned Media Measurement?
Earned media measurement is how you evaluate third-party validation. It’s quantifying how much (or little) unpaid coverage moves the business outcomes needle.
At its most basic level, EMV answers these questions:
- How much visibility did we generate?
- Did people engage with that coverage?
- Did it influence pipeline, revenue, or perception?
But enterprise-level earned media measurement goes much further. It connects PR activity directly to business growth metrics across the organization — from marketing and sales to hiring and investor relations.
It’s not just about mentions or reach anymore. Meaningful quantification requires a multi-layered system that evaluates how earned coverage leads target audiences from “I’ve heard of you” to “Take my money.”
The 4 Layers of Earned Media Measurement
Let’s make this actionable. Think in terms of four distinct measurement layers:
1. Visibility (Top-of-funnel)
- Impressions
- Reach
- SOV
- Tier 1 vs. Tier 2 Placements
2. Engagement (Mid-funnel)
- CTR
- Time on Site
- Social Shares and Amplification
- Content Downloads
3. Influence (Pipeline-level Impact)
- Traffic to High-intent Pages
- MQLs
- SQLs
- Assisted Conversions
4. Outcomes (Business Results)
- Pipeline Generated or Influenced
- Revenue Contribution
- Sales Velocity (shortened deal cycles)
- Hiring Lift (increase in qualified applicants)
- Fundraising Momentum (investor inbound, credibility signals)
Each layer builds on the one before it. Visibility needs engagement. Engagement needs influence. And influence needs outcomes. Without the compounding complimentary nature of these layers, PR measurement collapses.
From Activity to Tracking Impact Measurement
Traditional PR reporting tends to stop at visibility, whereas the modern earned media analytics finish line extends to outcomes.
That shift is what transforms earned media into a performance channel. It also changes how success is defined.
It’s not “Did we get coverage?” but “Did that coverage lead to real growth?”
Key Insights
- Earned media measurement is about quantifying business impact, not just tracking media coverage or visibility.
- Earned media operates across four layers: visibility, engagement, influence, and outcomes, forming a full-funnel view.
- Modern earned media measurement connects PR to pipeline, revenue, hiring, and brand authority — not just impressions.
- The goal is to shift from activity-based reporting to outcome-based performance tracking.
- Effective earned media measurement requires cross-functional alignment, tying PR metrics to sales, marketing, and leadership KPIs
Pro Tip: Assign every earned media metric to a functional owner — for example, pipeline metrics to Sales, hiring metrics to HR, and authority metrics to executive leadership. This ensures PR measurement is tied directly to accountability, not just reporting.
For more on effective PR reporting, read our guide: PR Reporting – Displaying Metrics for Success [+3 Examples]
Why Most Companies Measure PR Wrong
Even companies that invest in PR appropriately at every stage of growth struggle with proving earned media ROI. And it’s usually due to methodology rather than lack of effort.
Teams keep leaning on outdated, vanity metrics that were never meant to measure impact. The result is a misrepresented PR performance that gets under-leveraged or completely dismissed from the decision-making process.
The Problem With Vanity Metrics
Impressions, reach, coverage volume, etc. are more reportable than defensible. They’re good for answering how many people could have seen something but not what actually happened because of it.
And while an impression spike looks good in a report, without downstream signals — engagement, pipeline movement, or conversions — it offers little-to-no performance insight.
This drives a wedge between PR and other growth functions.
- Paid ads and demand gen are evaluated on cost per acquisition, pipeline contribution, and ROI.
- PR is often and mistakenly evaluated on visibility alone.
That gap not only makes budget increases harder to justify but also limits your ability to compare PR against other channels and optimize performance over time.
Why AVE (Advertising Value Equivalency) Is Flawed
AVE tries to assign a dollar value to earned media by estimating the cost of equal exposure in paid ads. But like watching YouTube cooking shorts to learn new recipes, what seems useful at first, in practice, is deeply flawed.
Here’s why:
- It assumes earned media equals paid media (they are fundamentally different).
- It ignores credibility and trust dynamics that make earned media more influential.
- It doesn’t account for audience relevance or intent.
- It has no direct correlation to pipeline or revenue.
Example: A $50K AVE figure doesn’t equal $50K in business impact because it doesn’t tell you whether PR contributed to growth, reduced acquisition costs, or accelerated deals.
In most cases, AVE ends up inflating perceived performance while masking actual impact.
Activity Doesn’t Equal Outcomes
Reporting on activity rather than results is another common issue with AVE.
Examples include:
- Number of Press Releases Issued
- Number of Media Pitches Sent
- Total Placements Secured
These are useful operational metrics — but they’re not related to performance.
Growth-stage PR budgets aren’t allocated based on activity. Spend is based on outcomes. If you don’t connect PR efforts to measurable business results, even strong coverage seems strategically meaningless.
Overcorrecting with Overcomplicated Attribution
On the flip side, some organizations try to fix gaps in measurement with overly complicated attribution models.
This leads to:
- Data Fragmentation Across Tools
- Analysis Paralysis
- Low Confidence in Reported Numbers
The reality of earned media impact is that it’s often indirect and multi-touch. If you try to force perfect attribution, you’ll create more confusion than clarity.
The goal isn’t to be perfect — it’s to gain reliable, guiding insights that inform decision-making.
The Main Issue: Misalignment With Business Objectives
Earned media measurement fails when it’s not aligned with how a business defines success.
When PR operates in isolation:
- Marketing Tracks Leads
- Sales Tracks Revenue
- PR Tracks Coverage
A modern measurement framework fixes this flaw by aligning traditional metrics with:
- Pipeline Generation
- Revenue Influence
- Sales Efficiency
- Talent Acquisition
- Market Positioning
Key Insights
- Most companies rely on vanity metrics (impressions, reach, coverage volume) that don’t reflect real business impact.
- AVE is fundamentally flawed, offering inflated and misleading representations of PR performance.
- Reporting often focuses on activity (placements, pitches) instead of outcomes like pipeline, revenue, or conversions.
- Many teams either ignore attribution entirely or overcomplicate it, leading to poor visibility or low confidence in results.
- The root issue is misalignment with business objectives, where PR metrics aren’t tied to growth, making ROI difficult to prove.
Pro Tip: If a metric doesn’t help you make a decision on budget, hiring, or strategy, it’s not a true KPI — it’s a reporting artifact.
Need to measure thought leadership coverage? Learn more here: How to Measure Thought Leadership: Metrics, Strategies, and KPIs
4 Core Earned Media ROI Models
You need clear and repeatable calculation models if you want to take earned media from a visibility function to a performance channel. Don’t rely on a single measurement approach. Layer multiple models together to capture every stage of impact from awareness to revenue.
Here are four practical earned media ROI models that balance simplicity, credibility, and business relevance:
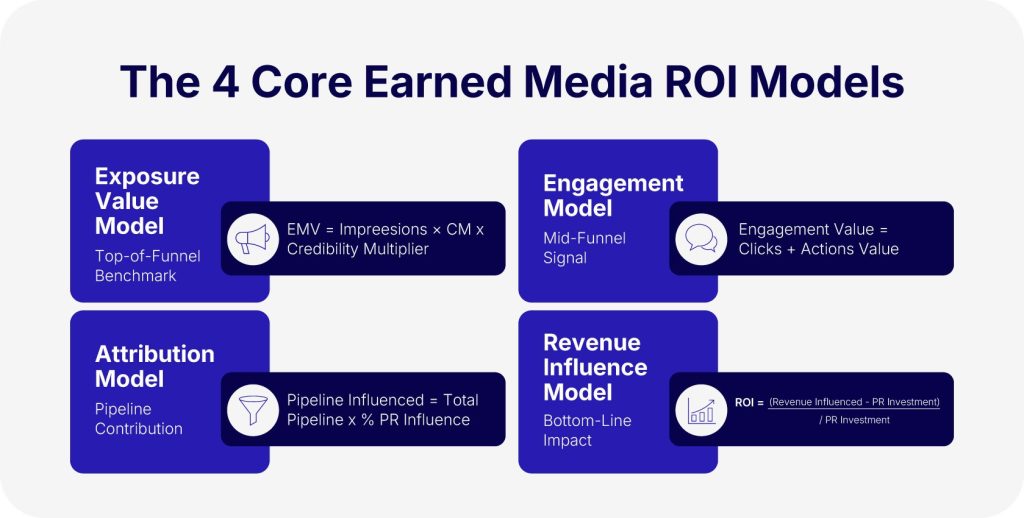
1. Exposure Value Model (Top-of-Funnel Benchmark)
This measures the estimated value of visibility generated by media coverage. It’s the most accessible model and often the starting point for organizations moving away from basic impression reporting.
Formula: EMV = Impressions × CPM Equivalent × Credibility Multiplier
How it works: Take the total potential audience reach (impressions), multiply that by what you would pay per 1,000 impressions in paid media (CPM equivalent) and the adjustment factor (typically 1.5x–3x) to reflect the added trust of earned media.
Example: 500,000 impressions × $20 CPM × 2.0 = $20,000 EMV
Pros:
- Benchmarking Campaign Reach
- Comparing Earned vs. Paid Efficiency
- Providing a High-level “Visibility Value” Snapshot
Cons:
- Doesn’t Measure Engagement or Outcomes
- Not a Business Impact Metric
This model is best used for top-of-funnel reporting and early-stage measurement maturity.
2. Engagement Model (Mid-Funnel Signal)
This measures the quality of audience interaction with earned media coverage. It answers whether or not people actually paid attention.
Formula: Engagement Value = (Clicks × CPC Equivalent) + (Engagement Actions × Assigned Value)
Key inputs:
- Click-throughs to Your Site
- Time on Site or Content Consumption
- Social Shares and Amplification
- Downloads or Newsletter Sign-ups
Example: 2,000 clicks × $5 CPC = $10,000 engagement value
Pros:
- Validates Audience Relevance
- Highlights Which Placements Drive Action
- Bridges the Awareness–Intent Gap
Cons:
- Doesn’t Confirm Pipeline or Revenue Impact
- Requires Clean Tracking (UTMs, analytics)
This model is best used for evaluating coverage quality — not just quantity.
3. Attribution Model (Pipeline Contribution)
This measures how earned media contributes to pipeline creation and progression. It’s where PR starts to align directly with marketing and sales performance.
Formula: Pipeline Influenced = Total Pipeline × % Attributed to Earned Media
Approaches to attribution:
- First-touch: PR introduces the brand.
- Assisted: PR supports conversion alongside other channels.
- Self-reported: “How did you hear about us?”
Example: $2M pipeline × 15% influence = $300K influenced
Data Sources:
- CRM Systems
- Marketing Automation Platforms
- Attribution Tools and UTM Tracking
Pros:
- Connects PR to Real Demand Generation
- Demonstrates Contribution to Revenue Pipeline
- Aligns PR with Marketing KPIs
Cons:
- Attribution is Directional — Not Exact
- Multi-touch Journeys Might Dilute Visibility
This model is best used for tying PR to pipeline growth.
4. Revenue Influence Model (Bottom-Line Impact)
This measures the direct and indirect impact of earned media on revenue outcomes. It’s the most advanced and executive-relevant model.
Formula: Earned Media ROI = (Revenue Influenced – PR Investment) / PR Investment
Example: $500K influenced revenue – $100K PR cost = 4x ROI
What to include:
- Closed-won Deals Influenced by Earned Media
- Acceleration of Deal Cycles (faster time to close)
- Increased Conversion Rates from High-authority Coverage
Pros:
- Directly Supports Budget Decisions
- Positions PR as a Revenue driver
- Enables Comparison with Other Growth Channels
Cons:
- Requires PR, Marketing, and Sales Alignment
- Influence is Harder to Isolate in Complex Cycles
This model is best for board-level and strategic budget allocation.
How These Models Work Together
Each model represents a different layer of impact:
- Exposure Model: Did people see it?
- Engagement Model: Did people interact with it?
- Attribution Model: Did it influence pipeline?
- Revenue Model: Did it drive business results?
Use them together to create a full-funnel measurement system that reflects how earned media actually works in modern buyer journeys.
Pro Tip: Don’t rely on a single model. The most credible earned media measurement strategies layer 2–3 models together, balancing simplicity with business relevance.
Learn more about modern earned media here: Earned Media in the Digital-First World: The Ultimate Guide to No-Cost Coverage [Examples + Tips]
Earned Media Value vs Business Impact
A common and costly earned media measurement mistake is treating EMV as the end goal when it’s actually a proxy metric.
Is earned media driving meaningful business outcomes? That’s the question you need to be asking — and EMV alone doesn’t answer it.
What EMV Actually Represents
EMV provides a standardized way to estimate the relative value of media coverage. In practice, it’s helpful for:
- Benchmarking Campaign Performance
- Comparing Earned vs. Paid Media Efficiency
- Communicating Visibility at a High Level
But EMV doesn’t quite cut it when it comes to calculating impact.
Example: Your B2B SaaS company secures a feature in a Tier 1 publication. You measure 800,000 impressions with a $25 CPM benchmark and 2x credibility multiplier — your EMV = $40,000.
While this looks like a strong result on paper, without additional context, it leaves out answers to key questions like:
- Was the audience relevant?
- Were Decision-makers engaged?
- Did it influence pipeline or revenue?
What Business Impact Looks Like
Impact goes beyond estimated value to focus on these measurable outcomes tied to growth:
- Pipeline Influence: Did coverage drive or accelerate qualified opportunities?
- Revenue Contribution: Did it impact closed-won deals?
- Sales Velocity: Did credibility from media shorten deal cycles?
- Hiring Lift: Did it increase applicant quality or volume?
- Fundraising Momentum: Did it improve investor confidence or inbound interest?
- Brand Authority: Did it elevate positioning in the market?
Example (Same Coverage, Deeper Analysis): You got 3,200 website visits from the article, 180 demo requests, 45 sales-qualified leads (SQLs), $600K pipeline generated, and $150K closed revenue within one quarter.
Now, the story changes. The same placement that produced $40K EMV also contributed to $600K pipeline and $150K revenue.
And that’s the difference between visibility reporting and business impact measurement.
Side-by-Side Comparison
| Metric Type | Example | Business Relevance |
| EMV | $500K EMV | Low |
| Engagement | 3,000 clicks | Medium |
| Pipeline Influence | $250K pipeline | High |
| Revenue Impact | $120K closed revenue | Very High |
Why Does this Distinction Matter?
If you treat EMV as the primary KPI, your PR becomes a basic reporting function with no connection to growth.
This leads to:
- Inflated Success Perceptions (without real outcomes)
- Difficulty Defending or Increasing Budgets
- Misalignment with Marketing, Sales, and Leadership
Example: Your communications team reports they generated $250K in EMV this quarter. Your executive response is, “That’s great — but what did it actually do for the business?”
Now, let’s say your communications team reports that earned media influenced $1.2M in pipeline and accelerated enterprise deal cycles by 15%.
The latter directly informs:
- Budget Allocation
- Hiring Decisions
- Growth Strategy
Reframing the Role of EMV
So, we’re not ditching EMV — we’re just putting it in a more strategic place within a broader measurement framework.
Think of it as:
- A top-of-funnel benchmark rather than a success metric.
- A supporting data point rather than a standalone KPI.
- A starting point rather than the final answer.
Balanced Reporting Example
A monthly report might include:
- $75K EMV (visibility benchmark)
- 5,000 engaged visits (engagement signal)
- $900K influenced pipeline (growth metric)
- $220K closed revenue (business outcome)
This layered view not only allows stakeholders to see what PR generated but how it contributed across the entire funnel.
Key Insights
- EMV is a proxy, not a true performance metric — it estimates visibility, not business impact.
- High EMV does not guarantee engagement, pipeline, or revenue, making it insufficient on its own.
- Business impact metrics (pipeline, revenue, sales velocity, hiring, authority) are what drive executive decisions.
- The most effective reporting connects visibility to engagement, pipeline, and revenue in a full-funnel view.
- EMV should be used as supporting context, while primary focus stays on measurable outcomes like pipeline and revenue.
Pro Tip: Use EMV to contextualize performance — but anchor your reporting in pipeline and revenue metrics. That’s what drives executive decisions.
Learn more about key PR metrics here: 10 Key PR Metrics You Must Measure to Gauge Success
How to Build an Earned Media Reporting Dashboard
You need more than a coverage summary from your reporting dashboard. Translating activity into performance is the goal.
For executives, more data isn’t the answer. You need decision-ready insights into:
- What’s working?
- What’s driving impact?
- Where to invest more?
A well-structured dashboard covers those questions by connecting earned media to pipeline, revenue, and strategic outcomes.
Core Principles of an Effective Dashboard
Here are a few guiding principles before diving into structure:
- Align with Business Objectives: Every metric should map to growth (pipeline, revenue, hiring, etc.).
- Layer Metrics by Funnel Stage: Visibility to Engagement to Influence to Outcomes.
- Prioritize Clarity Over Volume: Fewer, more meaningful metrics outperform cluttered dashboards.
- Standardize Reporting Cadence: Monthly or quarterly views drive better trend analysis.
The 5 Core Sections of an Earned Media Dashboard
A high-performing dashboard is typically organized into five sections:
1. Coverage Overview
This is your visibility layer. It shows a snapshot of coverage and reach.
Key metrics include:
- Total Placements
- Tier 1 vs. Tier 2 Coverage
- SOV (if available)
- Estimated Reach or Impressions
- EMV
Example:
- 25 total placements
- 8 Tier 1 features
- 1.2M total impressions
- $85K EMV
The purpose is to establish baseline visibility and media momentum.
2. Engagement Metrics
This is the quality layer. It shows how audiences interacted with coverage.
Key metrics include:
- Referral Traffic from Earned Media
- CTR
- Average Time on Site
- Social Shares and Amplification
- Content Downloads or Sign-ups
Example:
- 4,500 referral visits
- 2.8% CTR
- 2:45 avg. session duration
- 320 social shares
The purpose of this layer is to validate whether coverage is reaching and resonating with your target audience.
3. Pipeline Influence
This is the growth layer. It shows how earned media contributes to demand gen.
Key metrics include:
- MQLs from PR
- SQLs Influenced
- Pipeline Generated or Influenced
- Assisted Conversions
Example:
- 220 MQLs attributed to earned media
- 60 SQLs influenced
- $750K pipeline generated
The purpose of this layer is to connect PR directly to revenue-generating activity.
4. Revenue Impact
This is the business layer. It shows the bottom-line contribution of earned media.
Key metrics include:
- Revenue Influenced (closed-won deals)
- Conversion Rate from PR-driven Leads
- Sales Velocity Improvements
- Cost Per Acquisition (if applicable)
Example:
- $180K closed revenue influenced
- 22% higher conversion rate vs. non-PR leads
- 15% faster deal cycles
The purpose of this layer is to position PR as a measurable growth driver.
5. Brand Authority Signals
This is the strategic layer. It shows longer-term indicators of marketing positioning and credibility.
Key metrics include:
- Tier 1 Media Placements
- Executive Quotes and Thought Leadership Features
- Speaking Invitations or Analyst Mentions
- Backlinks and Domain Authority Impact
Example:
- Featured in 3 top-tier industry publications
- 5 executive quotes included in trend articles
- 12 high-authority backlinks earned
The purpose of the layer is to capture the compounding value of earned media beyond immediate pipeline.
Monthly Snapshot Example
| Metric | This Month | Last Month | Change |
| Total Placements | 25 | 18 | +39% |
| Referral Traffic | 4,500 | 3,200 | +41% |
| Pipeline Influenced | $750K | $500K | +50% |
| Revenue Influenced | $180K | $120K | +50% |
| PR Investment | $90K | $85K | +6% |
| ROI | 2.0x | 1.4x | 1 |
From Reporting to Optimization
Your dashboard shouldn’t just show performance — it should inform action.
For example:
- If Tier 1 placements drive higher conversion rates, prioritize similar outlets.
- If certain topics generate more pipeline, double down on those narratives.
- If engagement is high but pipeline is low, refine targeting or CTAs.

Pro Tip: Build your dashboard for decision-makers, not practitioners. If a metric doesn’t influence strategy, budget, or execution, it doesn’t belong on the dashboard.
Need help with entire campaigns? Meet Preston: the 2026 AI PR agent that runs your entire campaign
Board-Level Reporting Framework
This is where earned media reporting needs to shift from activity summaries to strategic, performance-based insights. Executives and board members aren’t evaluating secured placement quantities — they want hard evidence that PR is contributing to growth, efficiency, and market position.
You need a strong board-level reporting framework that translates earned media into the same language used across the business:
- Pipeline
- Revenue
- ROI
What Boards Actually Care About
Board members look at PR through four lenses:
- Revenue Impact: Is earned media influencing closed-won business?
- Pipeline Contribution: Is it generating or accelerating qualified opportunities?
- Efficiency: Are we getting strong returns relative to PR investment?
- Strategic Positioning: Is the company gaining authority in its category?
Your reporting risks being seen as purely informational if it doesn’t clearly address these areas.
5 Core Components of a Board-Level PR Report
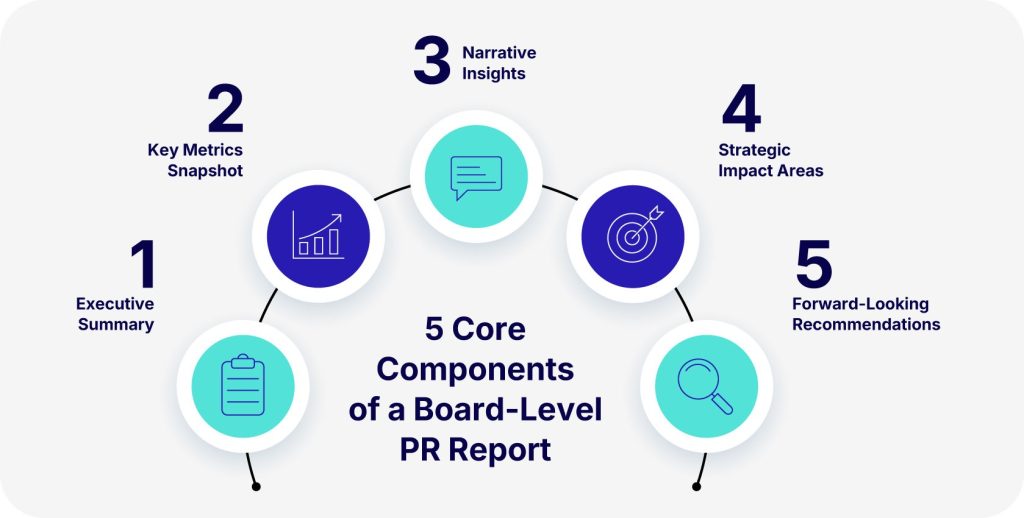
A board-ready report is concise, well-structured, and outcome-driven. It typically includes:
1. Executive Summary
This covers top-line performance. The purpose is to provide a clear, one-paragraph summary of performance.
Example: “Earned media contributed to $1.2M in influenced pipeline and $350K in closed revenue this quarter, delivering a 2.8x ROI. Tier 1 coverage in key industry publications accelerated enterprise deal cycles by approximately 18%.”
2. Snapshot of Key Metrics
This covers quantified impact. The purpose is to highlight the metrics that matter most — without going into too much detail.
Example table:
| Metrics | This Quarter | Last Quarter | Change |
| Pipeline Influenced | $400K | $250K | +60% |
| Revenue Influenced | $180K | $120K | +50% |
| PR Investment | $100K | $90K | +11% |
| ROI | 1.8x | 1.3x | 1 |
This works because it mirrors how boards already evaluate sales and marketing performance.
3. Narrative Insights
This answers what’s driving results. Provide context for hard data. The purpose is to explain changes in performance and what’s driving outcomes.
Example Insights:
- Tier 1 coverage targeting enterprise buyers increased inbound demo requests by 35%.
- Thought leadership placements improved conversion rates for mid-market deals.
- Consistent media presence strengthened brand recognition during active sales cycles.
This is the point where PR starts demonstrating strategic influence rather than just reporting results.
4. Strategic Impact Areas
Connect earned media to broader business priorities:
Pipeline Growth:
- Contribution to MQLs and SQLs
- Influence on High-value Opportunities
Sales Efficiency:
- Shortened Deal Cycles
- Increased Win Rates
Hiring & Talent:
- Increased Inbound Applications (from qualified candidates)
- Improved Employer Brand Visibility
Fundraising & Market Position:
- Increased Investor Interest or Inbound Inquiries
- Stronger Positioning in Competitive Narratives
Example: “Following consistent Tier 1 coverage, inbound interest from institutional investors significantly increased. This has contributed to stronger positioning during the current fundraising cycle.”
5. Forward-looking Recommendations
Don’t just summarize the past. Reporting at the board level should guide future decisions.
Examples:
- Double down on publications that are driving high-conversion traffic.
- Expand executive visibility in vertical-specific outlets.
- Align PR campaigns more closely with product launches and sales initiatives.
This reinforces PR as strategic rather than retrospective.
From Reporting to Capital Allocation
Earned media at this level is no longer a PR and marketing line item — it’s a key part of capital allocation strategy.
Boards want answers to these questions:
- Should we invest more in PR?
- Where are we seeing the highest returns?
- How does PR compare to other growth channels?
A solid earned media reporting framework answers those questions clearly and confidently.
Common Pitfall: Overloading the Board
If you want to lose credibility immediately, overload reports with:
- Coverage Lists
- Raw Media Mentions
- Granular Activity Metrics
Board reporting needs to be:
- Condensed (1–2 pages max)
- Outcome-focused
- Decision-oriented
Detailed reporting still has its place — but it belongs in operational reviews, not board decks.
Pro Tip: If your board report doesn’t include pipeline, revenue, and ROI, it’s not a board-level report — it’s a media recap.
Got a new board member or members? Here’s how to get the word out: New Board Member Press Release Guide 2025 [+ Examples]
8 Common ROI Measurement Mistakes
Despite their best intentions, many top organizations still stumble into predictable pitfalls when trying to measure earned media ROI. These errors not only disrupt reporting, they erode credibility, misdirect strategy, and curb budget growth.
Your aim isn’t necessarily perfect measurement — it’s reliable and decision-ready insight. Sidestepping these pitfalls is how you get there.
1. Overrelying on Impressions and Reach
Impressions are very visible and not at all actionable. They answer how many people could have seen something, but not if the right people engaged or took action.
If your campaign generates 1.5M impressions across multiple publications but has minimal referral traffic, no meaningful increase in demo requests, and no pipeline impact, what’s the point?
Sure, performance looks strong on paper. But in reality, it’s just high visibility with low relevance.
This is a problem because it inflates perceived success while masking weak performance.
2. Using AVE as a Primary KPI
AVE is still hanging around because it’s simple — but simplicity is far from accuracy.
If your PR report highlights $200K in AVE generated this quarter but can’t answer how much pipeline was influenced, whether conversion rates improved, or if revenue increased, what’s the point?
This is a problem because AVE creates a false sense of ROI without linking to outcomes. It leads to overconfidence in performance that isn’t actually yielding results.
3. Reporting Activity Instead of Outcomes
PR teams have a habit of falling back on operational metrics because they’re easy to track.
These include:
- Number of pitches sent
- Press releases distributed
- Total placements secured
Saying you secured 40 media placements this quarter sounds productive, but without context, what’s the point?
It doesn’t tell you if the placements were relevant or if they drove engagement.
This is a problem because activity metrics measure effort, not effectiveness. You allocate resources based on results, not output.
4. Ignoring Attribution
A lot of companies avoid attribution because it seems too complicated or imprecise. This results in siloed PR that’s disconnected from revenue conversations.
If you see a spike in inbound leads after major media coverage, but fail to track source attribution or self-reported discovery, what’s the point?
Your PR gets no credit, even though it influenced demand.
This is a problem because if you don’t even attempt attribution — even directionally — you’ll never demonstrate impact.
5. Overcomplicating Attribution Models
On the flip side, some teams try to build complicated attribution systems that are hard to maintain and even harder to trust.
If your multi-touch attribution model tracks dozens of variables across multiple tools, but data conflicts across systems, reports take weeks to produce, and stakeholders don’t trust the output, what’s the point?
This is a problem because complexity is contrary to clarity. If no one trusts the data, it won’t influence decisions.
6. Failing to Align with Business Objectives
A major fundamental issue is misalignment between metrics and goals.
- PR reports media mentions and SOV.
- Marketing covers MQLs and CAC.
- Sales is on pipeline and revenue.
There’s no shared framework connecting them — so what’s the point?
This is a problem because PR is isolated from growth conversations, making it harder to justify investment or demonstrate value.
7. Measuring in Silos Instead of Systems
Earned media isn’t independent — it influences and is influenced by other channels.
When a prospect reads your media feature, sees a retargeting ad, and attends a webinar, they’re more likely to convert. But if you measure this in isolation, what’s the point?
Siloed measurement only undervalues (or flat out ignores) earned media’s role in the journey.
This is a problem because it underrepresents PR’s true contribution in multi-touch buyer journeys.
8. Only Focusing on Short-term Metrics
When it comes to brand authority and trust, earned media often has compounding, long-term effects.
If your thought leadership article doesn’t generate immediate leads but contributes to increased win rates and inbound interest over time, there’s a point!
Short-term reporting misses the strategic value of always-on visibility and sustained credibility.
Pro Tip: If your measurement approach can’t connect earned media to pipeline, revenue, or strategic outcomes, it’s not an ROI framework — it’s a reporting exercise.
Find more resources on PR mistakes to avoid here:
How to Align PR Metrics With Business Objectives
Measurable and scalable earned media only happens when it’s in step with your definition of business success.
Misalignment and subsequent failed measurements occur when PR is doing one thing (only tracking coverage) while the rest of the organization is doing another (tracking pipeline and revenue).
Solve this issue by mapping earned media metrics directly to core business objectives. This ensures that earned media is contributing to the same outcomes as marketing, sales, HR, and executive leadership.
Here’s how to get started:
Goals Before Output
Alignment begins by turning the traditional approach on its head.
Instead of asking how many placements you secured, ask what outcomes you’re trying to drive this quarter.
Examples:
- Increase pipeline by 30%.
- Shorten enterprise sales cycles.
- Improve the quality of job applicants.
- Strengthen positioning ahead of fundraising.
Once you have clearly defined goals, earned media measurement becomes a matter of identifying how it supports each objective.
Map Metrics to Outcomes
Direct mapping is the best way to operationalize alignment.
1. Pipeline Growth
The goal is to generate more qualified opportunities.
PR contributes by:
- Driving Traffic to High-intent Pages (product, demo, pricing)
- Increasing Brand Awareness Among Target Buyers
- Supporting Demand Gen Campaigns
What to track:
- Referral Traffic (from earned media)
- MQLs
- SQLs
- Pipeline Generated or Influenced
Example: Your product feature in a high-intent industry publication drives 2,500 visits to a demo page, 120 MQLs, and $400K in influenced pipeline.
2. Sales Velocity
The goal is to close faster and more efficiently.
PR contributes by:
- Building Credibility and Trust (before sales conversations)
- Reinforcing Brand (during evaluation stages)
- Reduce Friction in Decision-making
What to track:
- Time to Close (deal cycle length)
- Conversion Rates for PR-influenced Leads
- Win Rate Improvements
Example: Prospects exposed to Tier 1 media coverage convert 20% faster and require fewer sales touchpoints.
3. Hiring and Talent Acquisition
The goal is to attract high-quality candidates.
PR contributes by:
- Strengthening Employer Brand
- Increasing Visibility Among Top Talent
- Highlighting Company Culture and Leadership
What to track:
- Career Page Traffic (from earned media)
- Application Volume and Quality
- Offer Acceptance Rates
Example: Following a leadership profile in a major publication, you see a 36% increase in career page traffic and a significant rise in applications from senior candidates.
4. Fundraising and Investor Confidence
The goal is to improve access to capital and investor interest.
PR contribute by:
- Building Market Credibility
- Signal Momentum and Traction
- Position Leadership as Category Experts
What to track:
- Investor Inbound Inquiries
- Mentions in Financial or Industry Press
- Engagement from Investor Audiences
Example: Consistent media coverage ahead of a funding round leads to increased inbound interest from institutional investors and stronger positioning during valuation discussions.
5. Brand Authority and Market Position
The goal is to become a recognized category leader.
PR contributes by:
- Securing Tier 1 Placements
- Publishing Thought Leadership
- Shaping Industry Narratives
What to track:
- SOV vs. Competitors
- High-authority Backlinks
- Speaking Opportunities and Media Quotes
Example: Your sustained thought leadership campaign results in a 3x increase in Tier 1 mentions plus invitations to keynote major industry events.
Create a Unified Measurement Framework
Once you’ve mapped out metrics, the next step is integration.
Take earned media out of the silo and plug it into existing systems:
- Marketing Dashboards
- CRM Platforms
- Executive Reporting Frameworks
This creates a unified source of truth where earned media performance is evaluated alongside:
- Paid Media
- Demand Gen
- Sales Performance
Operationalize Alignment Across Teams
When it comes to alignment, prioritize collaboration over metrics.
Best practices:
- Align PR and marketing on shared KPIs (pipeline, MQLs).
- Sync with sales to understand deal influence.
- Partner with HR on hiring metrics.
- Coordinate with leadership on strategic messaging.
This ensures PR is not only contributing to but measured against the same outcomes as the rest of the business.
From Alignment to Optimization
Once you’ve effectively tied the right metrics to business objectives, optimization becomes possible.
For example:
- If certain outlets drive higher conversion rates, prioritize them.
- If specific narratives generate more pipeline, expand them.
- If engagement is high but conversion is low, refine targeting.
Key Insights
- Start with business objectives first, then map PR metrics to those outcomes — never the other way around.
- Align earned media with core growth drivers like pipeline, revenue, sales velocity, hiring, and fundraising.
- Use specific, outcome-based metrics (e.g., MQLs, SQLs, influenced pipeline) to connect PR to performance.
- Integrate PR into shared systems and dashboards (CRM, marketing analytics) to create a unified view of impact.
- Cross-functional alignment with sales, marketing, HR, and leadership is essential to make PR measurable, credible, and scalable
Pro Tip: If your PR metrics don’t map directly to pipeline, revenue, or strategic business goals, they won’t influence decisions — and they won’t scale.
Want more insights on executive thought leadership? We’ve got you covered: Executive Thought Leadership: A Comprehensive Guide
PR Is a Growth Lever — Only If You Measure It Correctly
Earned media was never the problem — flawed measurement was the wrench in the works all along.
It’s time to stop evaluating PR through the limited lens of impressions, reach, and coverage volume. But visibility alone isn’t a growth driver. Set your sights on outcomes and stay focused.
Organizations seeing the greatest earned media ROI are the ones that treat it like any other performance channel — measured, optimized, and aligned with business objectives. The trick is to go beyond outdated proxies like AVE and instead zero in on what actually matters:
- Pipeline Influence
- Revenue Impact
- Sales Efficiency
- Hiring Outcomes
- Brand Authority
This shift changes everything.
A practice that primarily supported awareness is now your growth lever, and it’s capable of accelerating deals, improving conversion rates, attracting top talent, and strengthening market position.
But that only happens when measurement actively and incrementally proves impact.
The good news is that you don’t need perfect attribution to get there. You just need clear models, consistent frameworks, and a commitment to tying earned media to business results.
You won’t need to ask if PR is actually working every again. Results do the talking and budgets defend themselves. That’s your signal.
Turn Measurement Into a Competitive Advantage
If you want to understand how your earned media performance stacks up — and where to make adjustments — a PR Efficiency Audit or Performance Benchmark Review provides the clarity you need.
Because once you measure earned media with confidence, you grow it with intent. Book a free consultation with us and start connecting coverage to real outcomes and scaling what works.